Mine That Gold Miner
Mine That Bird was the long shot horse to win the 2009 Kentucky Derby with 50-1 odds. Weaving through the rest of the field, jockey Calvin Borel guided Mine That Bird through a small hole on the rail and onto winner's circle. For all the gamblers willing to take a chance on the long shot that day, a $2.00 bet paid out $103.20. Since the beginning of 2011, the Arca Gold Miners index has lost 27% while both gold and the S&P 500 index have positive returns over the same time period. The disparity of performance has left many investors wondering if gold miners are an undervalued long shot deserving another look.
The gold miners ETF (GDX) seeks to replicate the performance of the Arca Gold Miners index. The index represents a blend of small-, mid-, and large-cap gold mining stocks. Two of the top holdings within GDX are Goldcorp Inc (GG). and Newmont Mining Corporation (NEM). Together, the two account for over 25% of the total assets within the index. Although gold mining firms primarily produce gold, it is some of gold's by-products price performance that is contributing to driving gold mining stocks lower.
A by-product is an additional product derived from producing the main product. Assume for a moment that a mining company knows there is gold 100 feet below the surface in a specific area of land so they start digging. 50 feet into the dig they hit a pocket of copper. Since the copper has significant value, the miner will extract and sell the copper in the market. In this example, the copper is the by-product. By-products from mining gold include copper, silver, lead, and zinc.
The total cash cost to extract an ounce (oz.) of gold on a by-product basis is calculated by deducting by-product sales revenues from total production costs. In the example above, if it costs the miner $500 to dig the hole and extract the gold and he can sell the copper for $100 than the by-product cost to extract the gold is $400. Another way to calculate the cost to produce an oz. of gold is called the co-product cost. Plain and simple, the co-product cost method does not subtract by-product credits, so the cost per unit to extract the product will be higher. In the example above, the co-product cost to extract one oz. of gold would be $500.
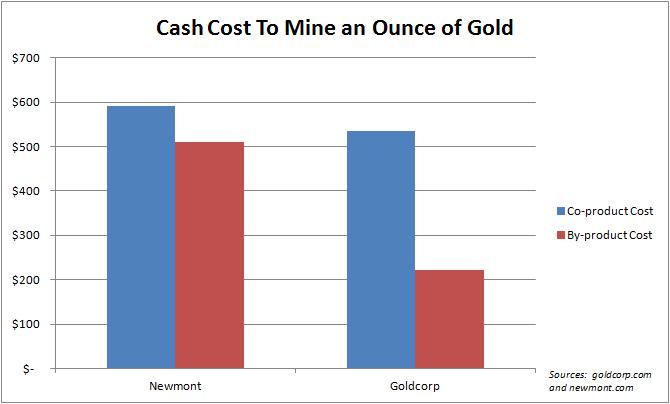
The larger the gap between the cash cost on a co-product cost versus the by-product cost, the greater the amount of other products the company is mining relative to the amount of gold. You can see from the chart below that Goldcorp has a much larger gap between its co-product cost and its by-product cost relative to Newmont.
(click to enlarge)
Generally speaking, the large gap for Goldcorp means that they are producing more by-products such as copper than Newmont. As a result, on paper they are able to lower their cost of producing gold because of the by-product credits. It also means that Goldcorp is more exposed to the by-product prices and Newmont is more exposed to gold prices. The amount of exposure to these various metals can have a significant influence on a company's stock price since each metal is used for different purposes and the price fluctuations can vary significantly.
Copper is the primary by-product when mining gold. While gold is primarily used as a "safe haven" investment and a hedge against inflation, copper is primarily used in building construction and power generation and transmission. As a result, copper has a much higher correlation with global economic growth. A look at the prices between the two metals shows that copper has declined 20% and gold has gained 14% since January 1st 2011. As I stated in the opening paragraph, the gold miners index is down 27% over the same time period. The chart below shows the performance of the two metals versus the stock price performance of Goldcorp using an index starting value of 100. It is apparent from the chart below that the lower copper price over the past year and a half has had a significant impact on its stock price.
(click to enlarge)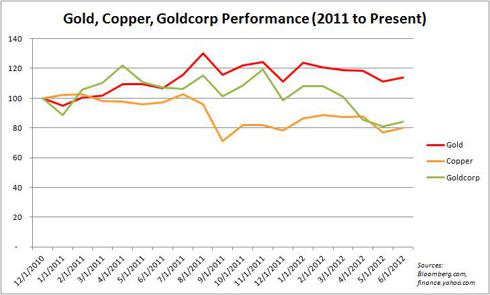
By-product prices are just one component that affects a gold miner's bottom line. The three largest operating cost categories consist of 22% labor, 14% contractors, and 17% fuel and power costs. Based on an average price of $1,572 per oz. of gold in 2011, Newmont's operating margin (revenue less co-product cost per oz.) was roughly $971. This is a significant margin considering that in 2009 gold was trading as low as $811, well below their 2011 operating margin. Many investors are left wondering if gold miners are undervalued and if they are the horse to bet on to gain exposure to gold instead of the underlying metal.
Once the global economy begins to recover and the demand for copper and inflation protection increases, the gold miner index will be the horse you will want your money on. Under these circumstances the trifecta wager would more than likely be miners to win, copper to place, and gold to show. However, due to the current economic environment and projected global growth over the near term, the odds of accelerated global growth and high inflation are closer to the odds that Mine That Bird saw back when he won the Kentucky Derby.
Disclosure: I have no positions in any stocks mentioned, and no plans to initiate any positions within the next 72 hours.
More articles by Luke Nagell »
The gold miners ETF (GDX) seeks to replicate the performance of the Arca Gold Miners index. The index represents a blend of small-, mid-, and large-cap gold mining stocks. Two of the top holdings within GDX are Goldcorp Inc (GG). and Newmont Mining Corporation (NEM). Together, the two account for over 25% of the total assets within the index. Although gold mining firms primarily produce gold, it is some of gold's by-products price performance that is contributing to driving gold mining stocks lower.
A by-product is an additional product derived from producing the main product. Assume for a moment that a mining company knows there is gold 100 feet below the surface in a specific area of land so they start digging. 50 feet into the dig they hit a pocket of copper. Since the copper has significant value, the miner will extract and sell the copper in the market. In this example, the copper is the by-product. By-products from mining gold include copper, silver, lead, and zinc.
The total cash cost to extract an ounce (oz.) of gold on a by-product basis is calculated by deducting by-product sales revenues from total production costs. In the example above, if it costs the miner $500 to dig the hole and extract the gold and he can sell the copper for $100 than the by-product cost to extract the gold is $400. Another way to calculate the cost to produce an oz. of gold is called the co-product cost. Plain and simple, the co-product cost method does not subtract by-product credits, so the cost per unit to extract the product will be higher. In the example above, the co-product cost to extract one oz. of gold would be $500.
The larger the gap between the cash cost on a co-product cost versus the by-product cost, the greater the amount of other products the company is mining relative to the amount of gold. You can see from the chart below that Goldcorp has a much larger gap between its co-product cost and its by-product cost relative to Newmont.
(click to enlarge)
Generally speaking, the large gap for Goldcorp means that they are producing more by-products such as copper than Newmont. As a result, on paper they are able to lower their cost of producing gold because of the by-product credits. It also means that Goldcorp is more exposed to the by-product prices and Newmont is more exposed to gold prices. The amount of exposure to these various metals can have a significant influence on a company's stock price since each metal is used for different purposes and the price fluctuations can vary significantly.
Copper is the primary by-product when mining gold. While gold is primarily used as a "safe haven" investment and a hedge against inflation, copper is primarily used in building construction and power generation and transmission. As a result, copper has a much higher correlation with global economic growth. A look at the prices between the two metals shows that copper has declined 20% and gold has gained 14% since January 1st 2011. As I stated in the opening paragraph, the gold miners index is down 27% over the same time period. The chart below shows the performance of the two metals versus the stock price performance of Goldcorp using an index starting value of 100. It is apparent from the chart below that the lower copper price over the past year and a half has had a significant impact on its stock price.
(click to enlarge)

By-product prices are just one component that affects a gold miner's bottom line. The three largest operating cost categories consist of 22% labor, 14% contractors, and 17% fuel and power costs. Based on an average price of $1,572 per oz. of gold in 2011, Newmont's operating margin (revenue less co-product cost per oz.) was roughly $971. This is a significant margin considering that in 2009 gold was trading as low as $811, well below their 2011 operating margin. Many investors are left wondering if gold miners are undervalued and if they are the horse to bet on to gain exposure to gold instead of the underlying metal.
Once the global economy begins to recover and the demand for copper and inflation protection increases, the gold miner index will be the horse you will want your money on. Under these circumstances the trifecta wager would more than likely be miners to win, copper to place, and gold to show. However, due to the current economic environment and projected global growth over the near term, the odds of accelerated global growth and high inflation are closer to the odds that Mine That Bird saw back when he won the Kentucky Derby.
Disclosure: I have no positions in any stocks mentioned, and no plans to initiate any positions within the next 72 hours.
More articles by Luke Nagell »
Mine That Gold Miner
![Mine That Gold Miner]() Reviewed by TA
on
19:32
Rating:
Reviewed by TA
on
19:32
Rating:


Aucun commentaire: